Command-line tool
Market research collector
I built this to read what paying customers complain about across four stores, in bulk, instead of one store page at a time.
- Kind
- Command-line tool
- Built with
- Python, SQLite
- Data
- Public store listings and reviews
- The problem
Deciding what to build usually starts from a guess. Posts saying "I'd pay for this" are weak evidence, because saying it costs nothing.
A two-star review of a product someone did pay for is much stronger. It shows a real buyer, and exactly what let them down. I wanted a way to look at that evidence in bulk instead of reading store pages one at a time.
- What I built
A command-line tool that collects public data from four stores and keeps it in a local SQLite file: Steam's indie top sellers with their user tags and reviews, itch.io's paid trending items with prices, the App Store's paid chart with its low-star reviews, and WordPress.org plugins with install counts and low-star review text.
A language model reads each review and sorts the complaint by topic. The raw answers are stored, so thresholds can change without paying for another pass.
Below is every report, run on a copy of the collected data. Reviewers' own words are left out of the pictures.
- What's selling
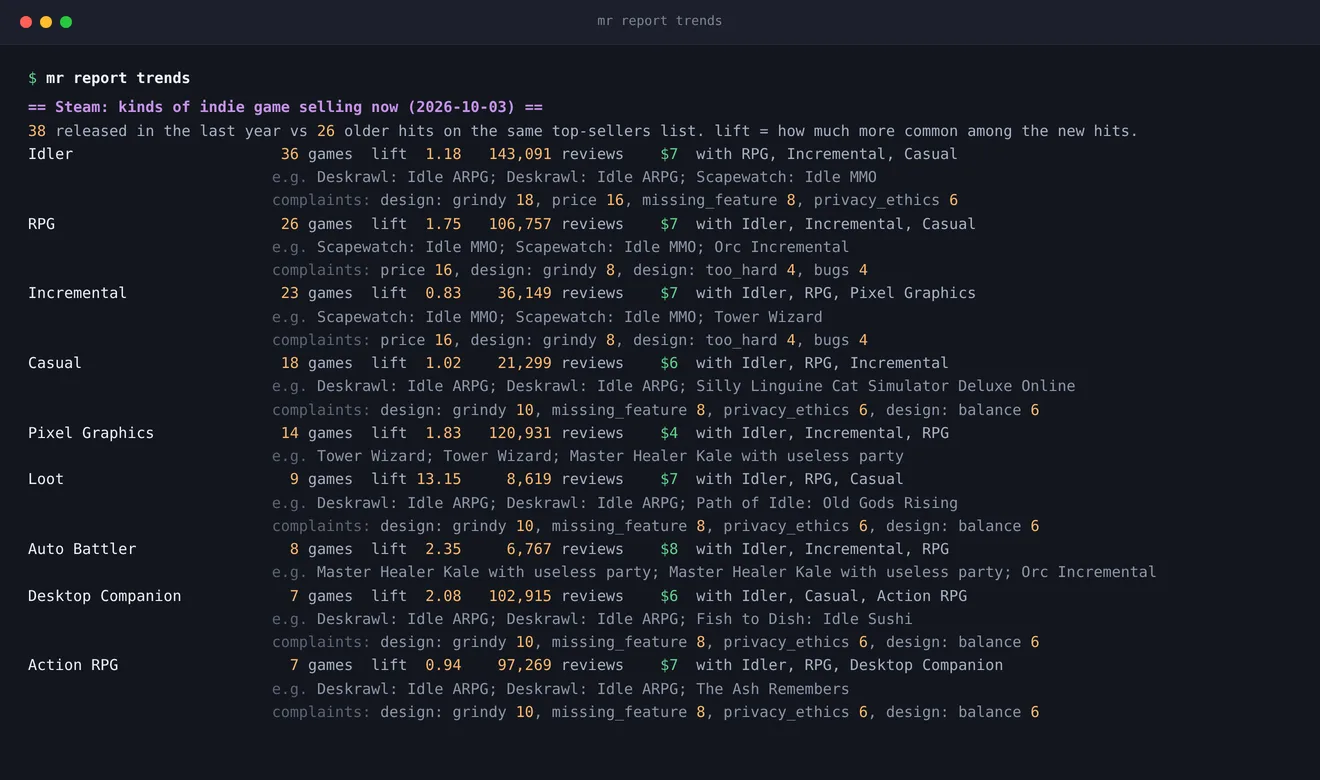
The starting point. Which kinds of indie game are selling on Steam right now.
Each row is a Steam tag, not a game. My first chart was per game, and all it told me was that people were unhappy with one game's design.
Lift compares this year's hits with older hits on the same list, so it's one snapshot until it's run again a month later.
A tag no older hit carries would divide by zero, so the counts are smoothed: Loot's 13.15 means "almost only new games", not an exact ratio.
Steam resets a game's release date when it leaves early access, so a game is also dropped when more than 5% of its reviews predate the last year.
- A closer look at one kind
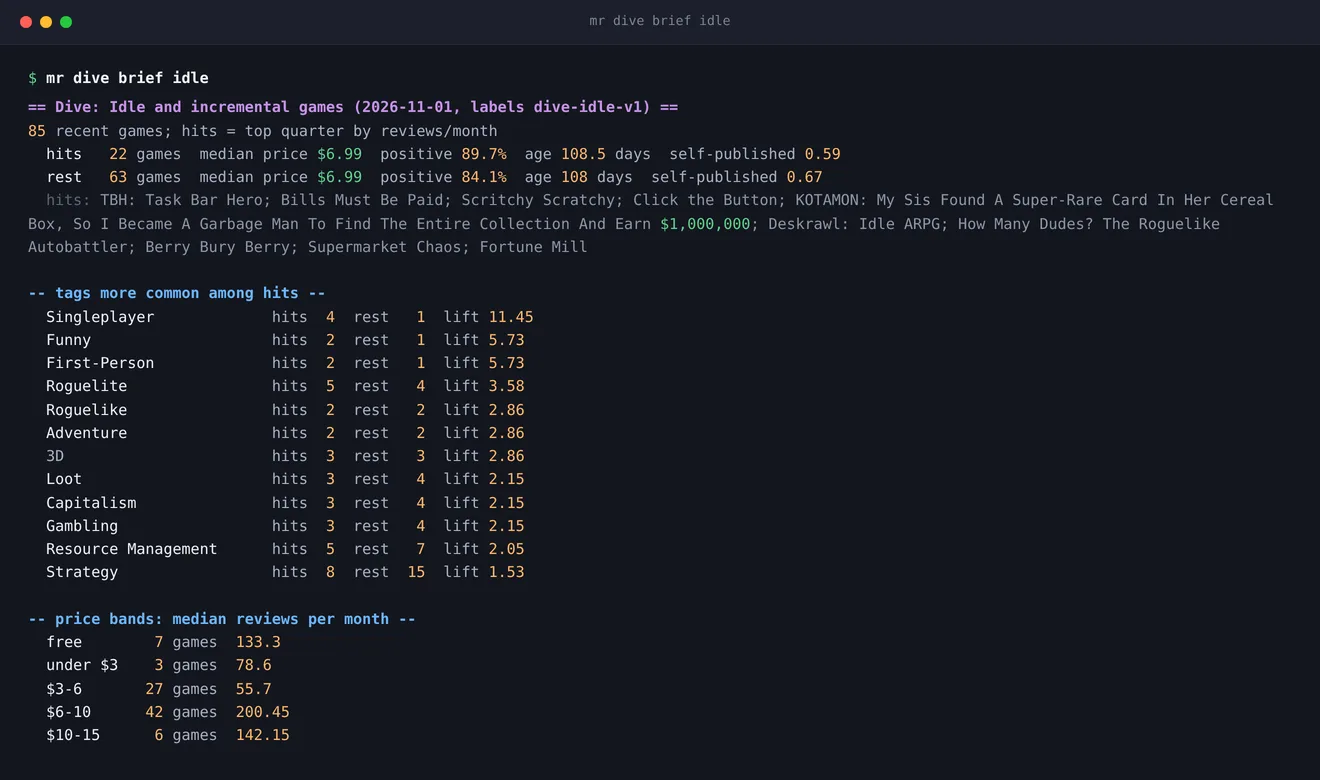
For a kind that looks promising there is a deeper look, called a dive. This one is small idle and incremental games.
A dive collects every recent game of the kind, not only the best sellers, so the hits can be compared with the rest.
A hit is the top quarter by reviews per month since release, so one week of a store-wide sale barely moves it.
What this one found: price isn't the gap. Hits and the rest both sell at a median of $6.99, and cheaper games don't get more reviews.
Buyers play for hours, then say the content ran out. The opening is length and depth, not a lower price.
- What buyers praise and blame
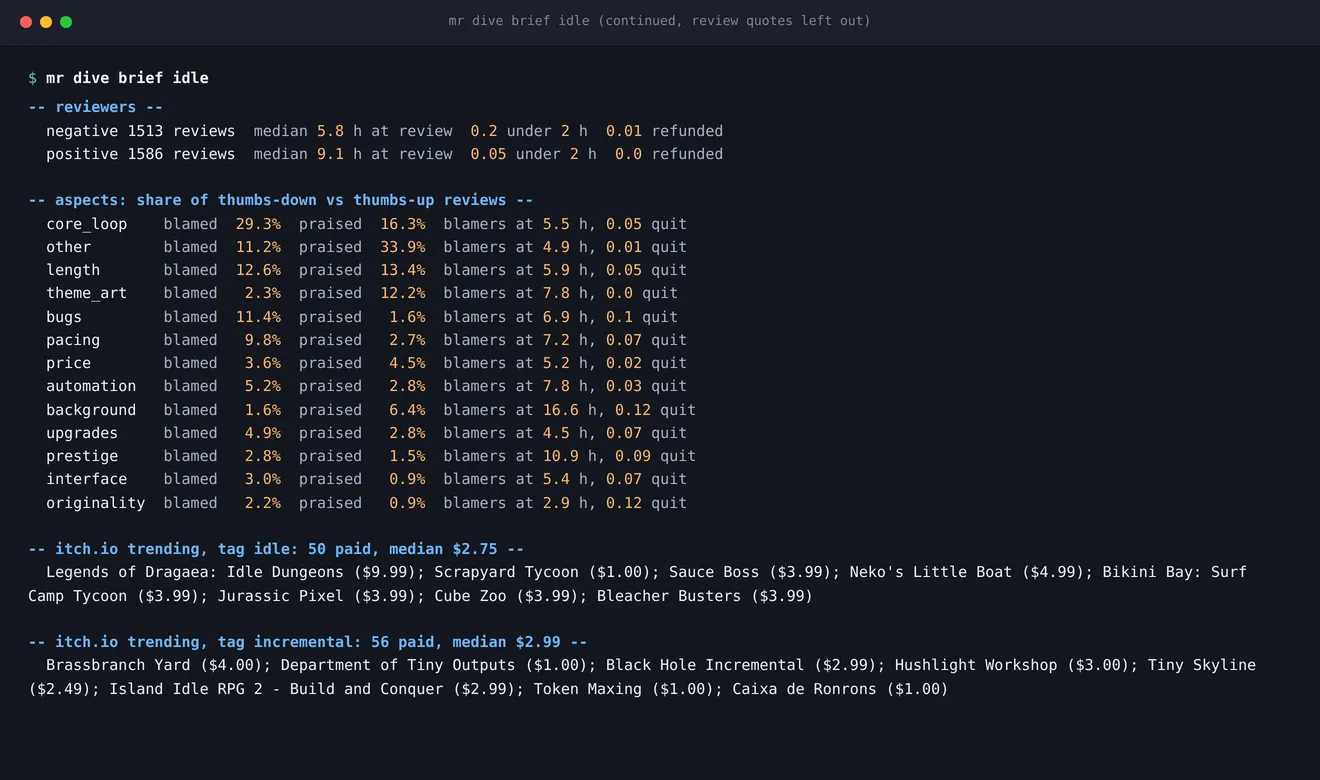
The rest of the same brief. Reviews come in thumbs-down and thumbs-up, so praise is counted as well as blame.
The aspects are chosen for each dive, and the language model sorts each review into one. Nothing about the reviewers themselves is stored, only hours played and whether they refunded.
- Complaints
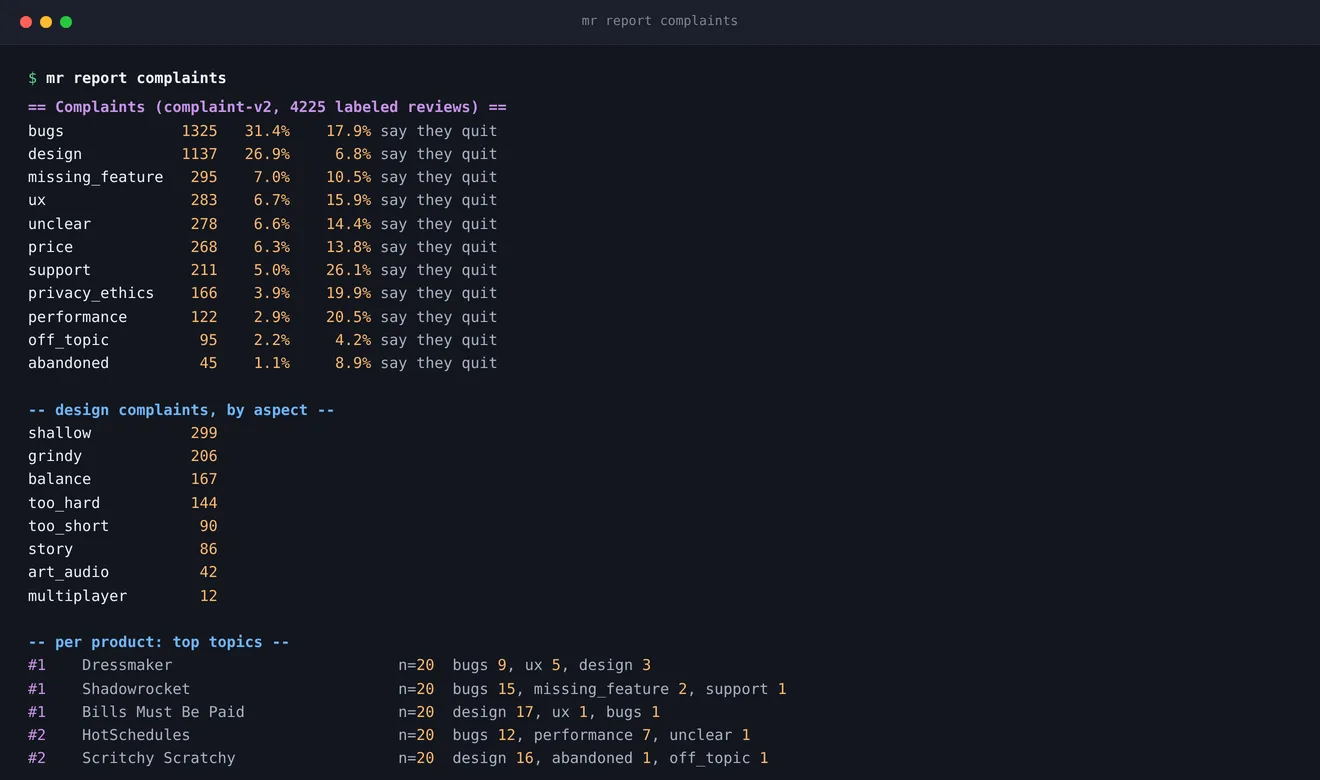
Every labelled review from the stores that have reviews, sorted by what went wrong.
The first version had no split, and half of all labels came back as "design", too broad to act on. So design complaints now say which part.
The model is generous with "say they quit": a review about one crash and a reboot still counted.
- Store reports
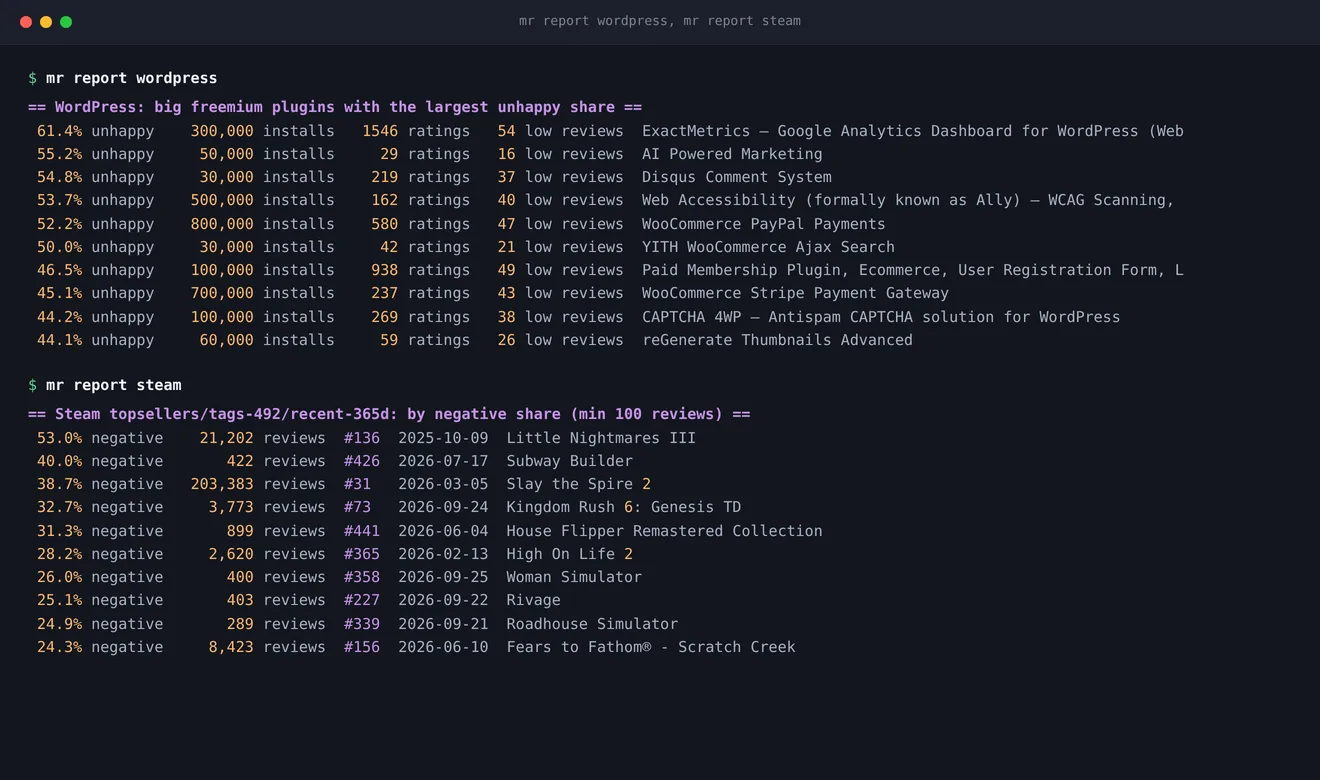
One report per store, each sorted by how unhappy the buyers are.
WordPress stayed in because freemium is normal there. Whether a plugin has a paid tier is guessed from its description, so it will misfire.
The most complained-about plugins are often payment gateways from large companies. The complaints are real, but they aren't something one developer can win.
- Sources
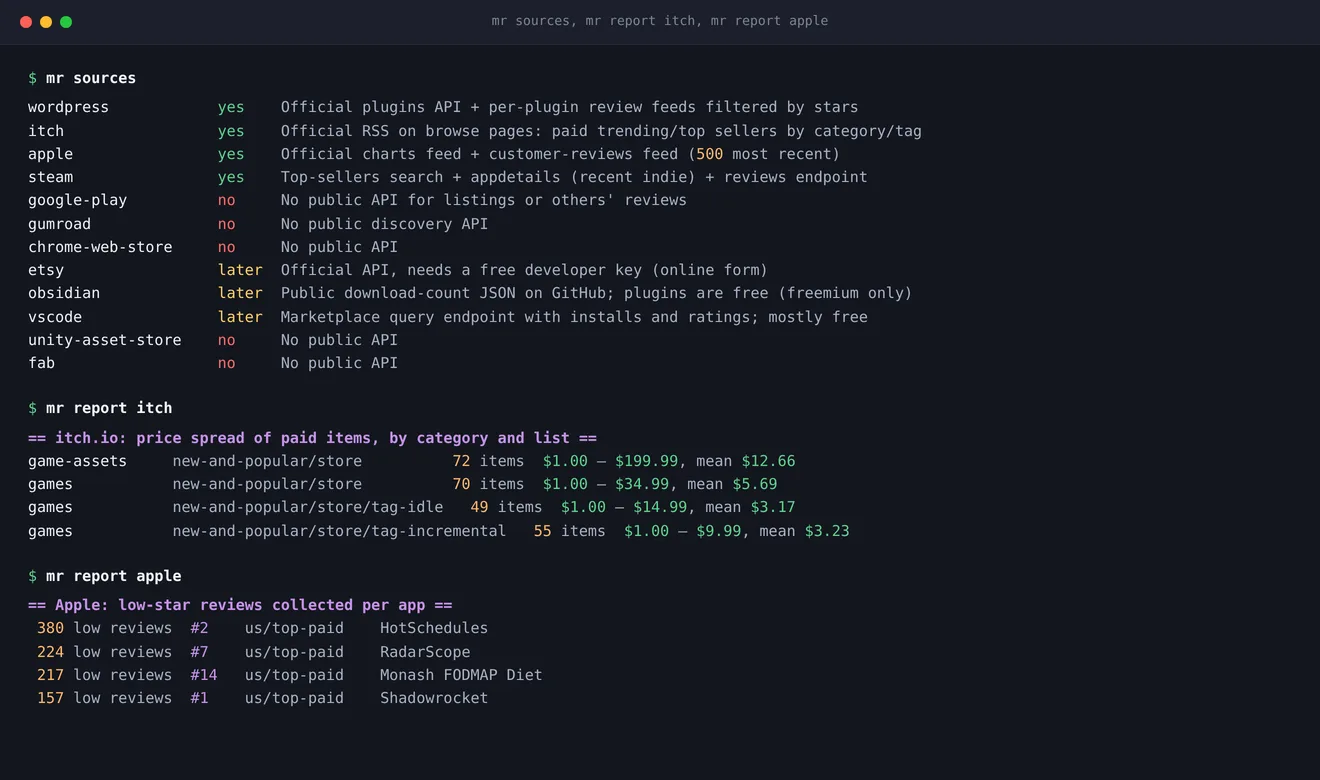
Where the data comes from, and two smaller reports.
Only public data: official APIs and feeds where a store has them, with requests spaced a second apart and identifying themselves.
Stores that can't be used stay on the list so I don't look into them twice.
itch.io shows no sales or reviews, only rank and price, and a few expensive bundles drag the mean up, so the spread matters more than the average.
- How it was checked
The first run of the complaint sorting was spot-checked against the review text. About 18 of 20 topics matched, and the misses were mixed reviews the model was unsure about.
One question it was meant to answer, whether a solo developer could fix a complaint, turned out not to separate anything. It scored 0.7 or higher on 99% of game complaints, so it isn't used to tell complaints apart.
A store-wide sale can make discounted games look like they're rising, so the dates of any sale are written down beside the numbers.
There is also a step that scores a pitch for a game against a dive's evidence. I have never compared its scores with how games really sold, so treat them as a first sort of ideas, nothing more.
Have something in mind?
A few sentences about the problem is enough to start.
contact@JordanAdair.ca